Building a Journey Dashboard with Native SFMC Components
Most Salesforce Marketing Cloud Engagement (SFMC) teams rely heavily on Journey Builder, but monitoring journey performance and activity health often requires navigating multiple screens, running manual checks, or exporting reports.
To solve this problem, I built a lightweight Journey Dashboard using only native SFMC components:
- Automation Studio
- SQL Query Activities
- Server-Side JavaScript (SSJS)
- Data Extensions
- CloudPages
No external databases. No middleware. No paid add-ons. Just SFMC.
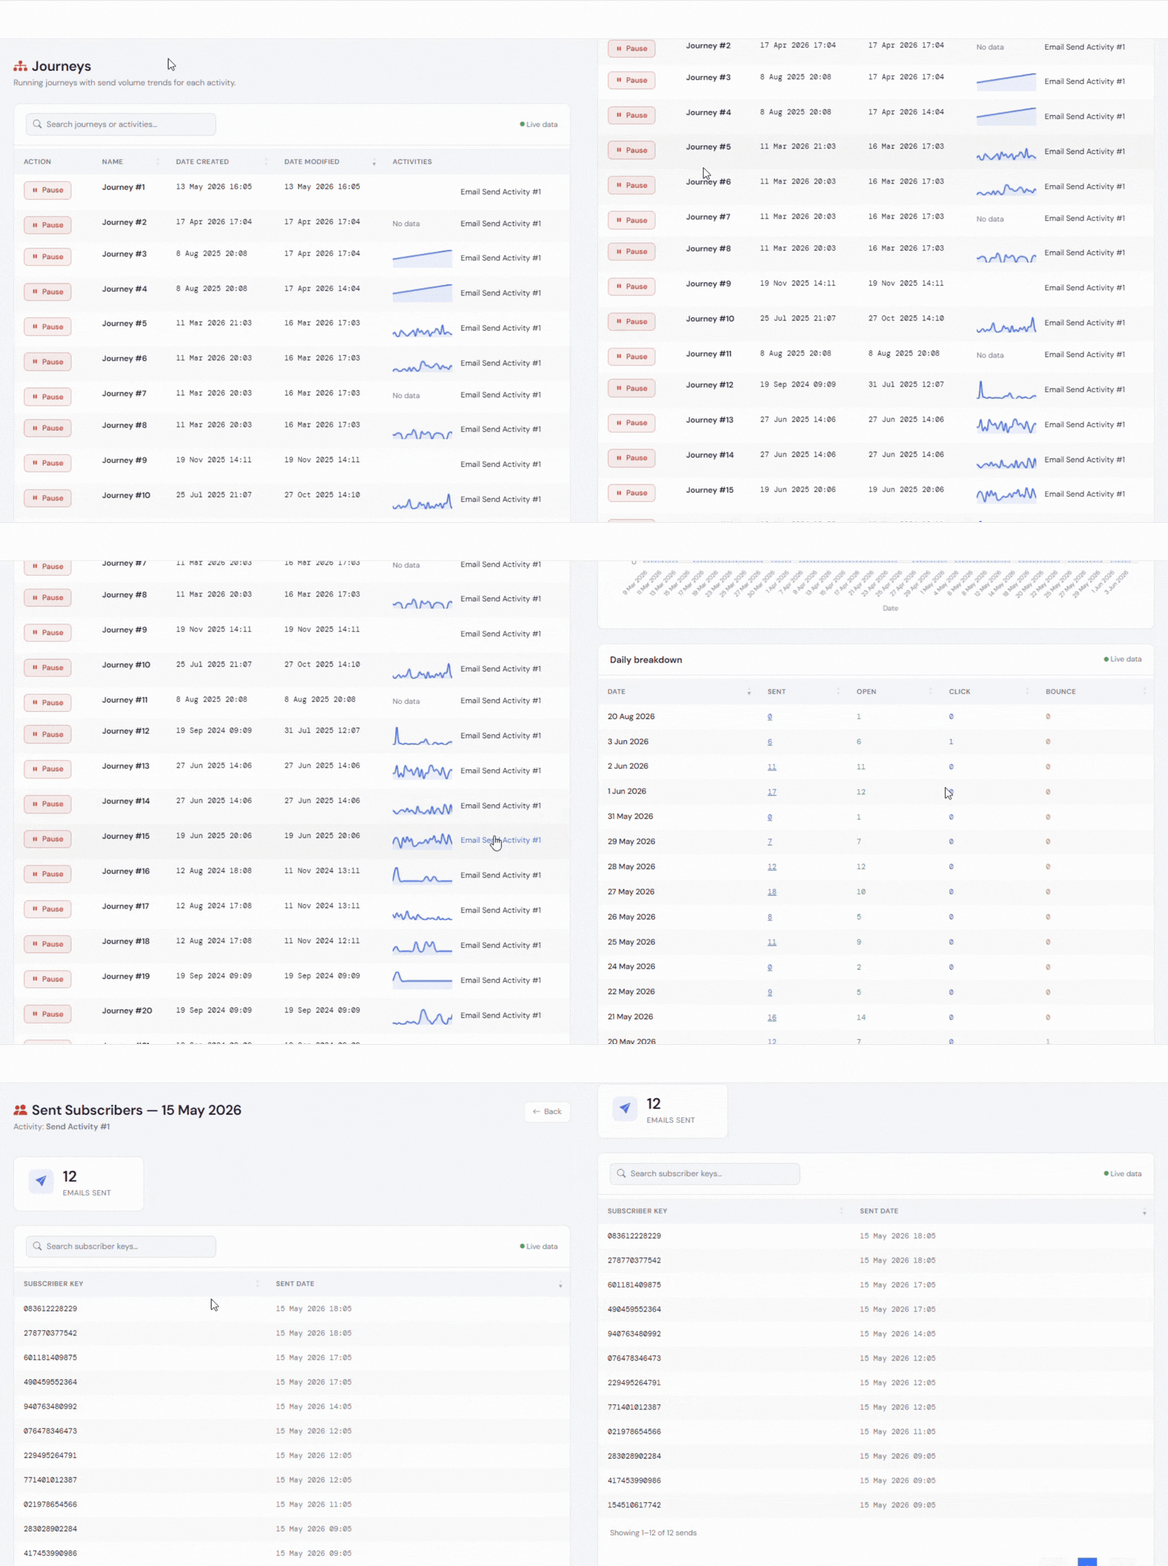
The Problem
As the number of journeys increases, it becomes difficult to answer simple operational questions:
- Which journeys are currently running?
- When was a journey last modified?
- Which activities are generating sends?
- Are send volumes increasing, decreasing, or flat?
- Which journeys may require investigation?
Whilst Journey Builder provides configuration and execution capabilities, obtaining a consolidated operational view often requires significant manual effort.
I wanted a single dashboard that would provide:
- Journey inventory
- Journey status
- Activity-level visibility
- Send volume trends
- Live operational monitoring
- Simple deployment process
The Solution
The solution leverages SFMC’s native APIs and data storage capabilities.
Architecture Overview
- Journey Builder
- REST API Calls
- Server-Side JavaScript
- Data Extensions
- SQL Aggregation Queries
- Dashboard CloudPage
The dashboard collects journey metadata, activity information, and send metrics before presenting them in a searchable user interface.
Key Features
1. Journey Inventory
The dashboard automatically retrieves all journeys from the business unit and displays:
- Journey Name
- Creation Date
- Last Modified Date
- Journey Status
- Journey Activities
This provides a centralised view that is often spread across multiple SFMC screens.
2. Activity-Level Visibility
Most reporting focuses on journey-level performance.
However, operational teams frequently need visibility into individual activities.
The dashboard breaks journeys down into their constituent activities, allowing users to identify:
- Email activities
- Entry events
- Wait activities
- Decision splits
- Other journey components
This makes troubleshooting considerably faster.
3. Send Volume Trending
One of my favourite features is the trend visualisation.
For each email activity, the dashboard tracks send volume over time and displays a simple sparkline chart.
This enables users to quickly identify:
- Normal activity patterns
- Sudden increases in volume
- Unexpected drops
- Potential entry source issues
Instead of opening reports individually, trends become visible at a glance.
4. Live Data Refresh
The dashboard is powered by scheduled automations.
Automation Studio periodically:
- Retrieves journey metadata
- Updates data extensions
- Aggregates send statistics
- Refreshes dashboard datasets
This ensures users are working with near real-time information without requiring manual intervention.
Technical Components
Data Extensions
A small number of data extensions are used for:
- Journey metadata
- Journey activities
- Send statistics
- Aggregated trend data
These act as the reporting layer for the dashboard.
Automation Studio
Automation Studio orchestrates the entire process.
Scheduled automations:
- Execute SQL queries
- Run SSJS activities
- Update reporting datasets
- Refresh trend metrics
This keeps the solution fully native to SFMC.
SQL Query Activities
SQL is used to:
- Aggregate send volumes
- Build trend datasets
- Transform API outputs
- Optimise reporting performance
By pre-processing data, dashboard load times remain fast even in larger environments.
Server-Side JavaScript
SSJS handles the heavy lifting.
It performs:
- REST API authentication
- Journey retrieval
- Activity extraction
- Data loading into Data Extensions
This enables the dashboard to stay synchronised with Journey Builder automatically.
Simple Deployment
With all the setups packaged in a JSON file, implementation is straightforward:
- Import assets using Package Manager
- Configure business unit credentials
- Run the automation
- Publish the Cloudpages
- Open the dashboard
Final Thoughts
One of the most valuable lessons I’ve learned in Salesforce Marketing Cloud is that many operational challenges can be solved using the platform’s existing capabilities.
This Journey Dashboard demonstrates how Automation Studio, SQL, Server-Side JavaScript, and Data Extensions can be combined to create a powerful monitoring solution without introducing external infrastructure.
The result is a lightweight, deployable, and scalable dashboard that helps teams gain better visibility into their Journey Builder ecosystem.